Z-Score: –
Conclusion: –

Note: This calculator assumes a two-tailed test, so if you’re interested in a one-tailed test, you’ll need to interpret the Z-score manually.
Table of Contents
How to use this Z-Test Calculator?
Steps
- Select the Confidence Level: Choose the confidence level suitable for your test.
- Enter Sample Mean (x̄): Type the average of the sample data in the corresponding field.
- Enter Population Mean (μ): Type the average of the entire population in the corresponding field.
- Enter Sample Size (n): Type the number of observations in your sample.
- Enter Population Standard Deviation (σ): Type the standard deviation of the population.
- Click the Calculate Button: After entering all the data, click the “Calculate” button.
- View the Results: Look at the “Z-Score” and “Conclusion” sections to interpret the results.
Interpretations
- If the conclusion is “Reject null hypothesis,” it means that the sample mean is significantly different from the population mean at the selected confidence level.
- If the conclusion is “Fail to reject null hypothesis,” it means that there’s not enough evidence to suggest that the sample mean is different from the population mean at the selected confidence level.
Demystifying the Z-Test: A Simple Guide to Understanding When and How to Use It
Let’s delve into the fascinating world of statistical hypothesis testing, particularly focusing on one of its most fundamental tools: the Z-test. Now, if the mere mention of ‘statistics’ or ‘Z-test’ sends you into a spiral of confusion, worry not! By the end of this article, you’ll not only understand what a Z-test is but also when and how to use it
What is a Z-Test, Anyway?
So, let’s start with the basics. A Z-test is a type of statistical hypothesis test that helps you determine whether the mean of a sample you’ve collected is statistically significantly different from the known mean of a whole population. In simpler terms, it’s like a fact-checker that tells you if the average value you’ve calculated from a small group is a reliable representation of a much larger group. Imagine polling a hundred people to predict the outcome of a presidential election. A Z-test can tell you whether that sample of 100 people is a good indicator of how the entire country will vote.
Why Would You Need a Z-Test?
The answer is quite straightforward: you often can’t survey an entire population. Whether you’re a researcher studying the effect of a new drug, a marketer trying to gauge the success of a recent campaign, or a student collecting data for a project, you’ll likely be working with samples. And here’s where the Z-test comes in handy—it helps you make accurate inferences about a whole population based on the sample data you have.
The Ingredients for a Z-Test
Armed with these numbers, you’re all set to perform a Z-test.
- Sample Mean (x̄): The average of the sample data you’ve collected.
- Population Mean (μ): The known average of the entire population.
- Sample Size (n): The number of observations in your sample.
- Population Standard Deviation (σ): The spread of the entire population data.
The Nuts and Bolts: How to Perform a Z-Test
The crux of a Z-test lies in calculating the Z-score, a simple formula that looks something like this:
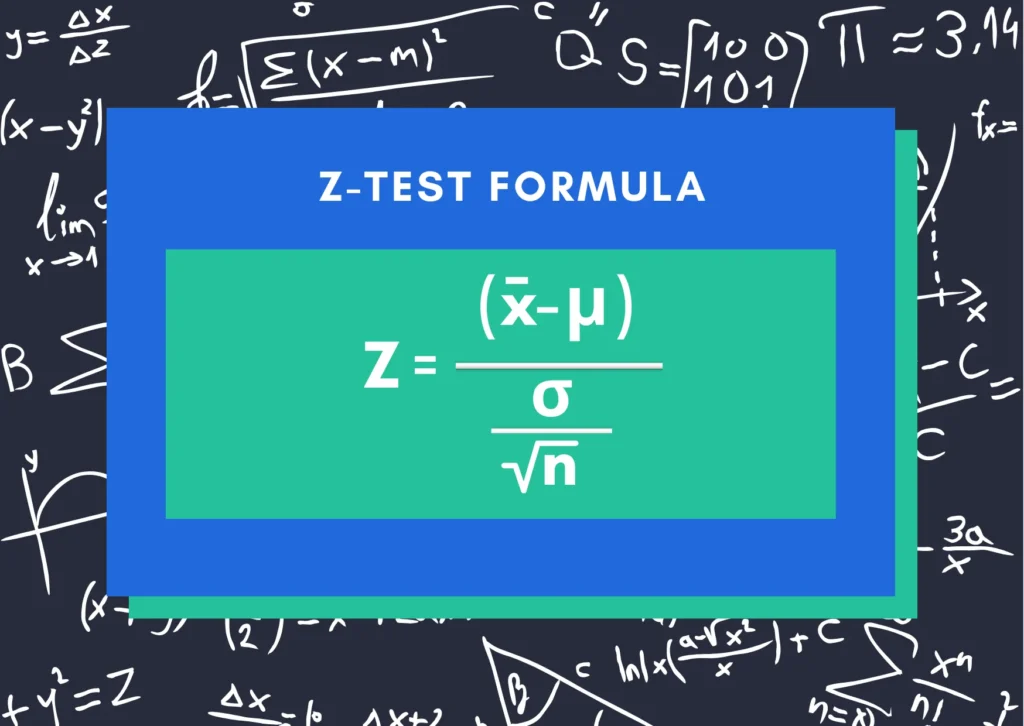
Don’t be intimidated by the formula; it’s simpler than it looks. You’re basically taking the difference between the sample mean and the population mean, and then dividing that by the standard error (which is the population standard deviation divided by the square root of the sample size). This Z-score will be your guide in determining whether to reject or accept the null hypothesis.
Interpreting the Z-Score
Once you’ve got the Z-score, the next step is to compare it against a critical Z-value that corresponds to a confidence level you’ve chosen (usually 95% or 99%). If the absolute value of the Z-score is greater than the critical Z-value, you can reject the null hypothesis. This means that the sample mean is significantly different from the population mean. On the flip side, if the Z-score is less than the critical Z-value, you fail to reject the null hypothesis, implying there’s not enough evidence to say the sample is different from the population.
When to Use Which? (One-Tailed vs Two-Tailed)
The terms ‘one-tailed’ and ‘two-tailed’ refer to the number of directions in which we are interested in testing our sample mean against the population mean. Allow me to clarify:
One-Tailed Test
In a one-tailed test, you’re essentially asking a directional question. You want to know if the sample mean is either significantly greater or significantly less than the population mean, but not both. For example, let’s say you’re a marketer who has tweaked an online ad campaign, and you want to know if the changes have increased the click-through rate. You’re not interested in whether the rate decreased; you only want to know if it went up. This is a perfect situation for a one-tailed test.
The critical Z-value in a one-tailed test is generally going to be larger in absolute terms if you’re looking at the tail at the extreme end of the distribution. This makes it ‘easier’ to reject the null hypothesis, but be cautious—this also increases the likelihood of a Type I error (falsely rejecting a true null hypothesis).
Two-Tailed Test
On the other hand, a two-tailed test doesn’t assume a direction. You’re asking if the sample mean is different from the population mean—either greater or less. Imagine you’re a quality control manager at a factory, and you want to know if a new manufacturing process has changed the average weight of a product. In this case, you’re interested in knowing if the weight has either increased or decreased, making a two-tailed test the appropriate choice.
The critical Z-value in a two-tailed test is generally smaller in absolute terms, making it ‘harder’ to reject the null hypothesis, which can be a safer approach to avoid Type I errors.
When to Use Which?
- Use a One-Tailed Test When: You have a specific direction in mind (greater or less), and you are okay with the increased risk of a Type I error for the benefit of a more sensitive test.
- Use a Two-Tailed Test When: You are interested in any kind of difference between the sample mean and population mean, irrespective of the direction. This is often considered a more conservative approach.
Confidence Levels and Two-Tailed Tests
You may have heard of terms like ‘confidence levels’ or ‘two-tailed tests.’ These are just ways to refine your Z-test. The confidence level, usually set at 95%, gives you the probability that your sample mean will fall within a certain range of the population mean. A two-tailed test, on the other hand, checks for deviations in both directions—whether the sample mean is either significantly higher or lower than the population mean.
Putting It All Together
So there you have it- a complete guide to understanding and using the Z-test. While it might seem daunting at first, remember that the Z-test is essentially a tool that helps you make sense of the data you have, allowing you to draw meaningful conclusions about a larger group based on a sample. Whether you’re in academia, business, or just satisfying your own curiosity, mastering the Z-test is a valuable skill that will help you navigate the complex, yet exciting, world of data and statistics.
Loved it? How about checking our All-in-One Descriptive Statistical Calculator or may be other Statistical Tools.